Miles Traveled Shape Outcomes: Integrating Journey Fatigue into Previews and Odds
Alex Beck · Jun 29, 2026

Miles Traveled Shape Outcomes: Integrating Journey Fatigue into Previews and Odds
Travel distance emerges as a measurable variable in performance data across soccer leagues and horse racing circuits, where extended journeys correlate with reduced output in subsequent events. Analysts incorporate these patterns when constructing match previews, adjusting expected goal tallies or finishing positions based on documented recovery timelines that stretch from 48 to 72 hours after flights exceeding four hours. Bookmakers reflect similar adjustments in odds compilation, widening margins for away sides returning from distant fixtures while tightening lines on rested home teams.
Performance Metrics Tied to Travel
Data from multiple European competitions show teams covering over 1,000 kilometers in the prior week record lower pass completion rates and fewer high-intensity sprints, according to aggregated tracking figures released by league statisticians. In June 2026, several clubs in continental schedules face back-to-back commitments separated by transcontinental flights, prompting preview writers to flag elevated injury risks for players logging more than six hours in transit. Horse racing records reveal parallel effects, with runners arriving from interstate hauls posting win percentages that drop by roughly eight points compared to local stables, per industry compilations maintained by Australian racing authorities.
Preview Construction Practices
Preview teams now layer travel logs into standard assessments, cross-referencing fixture lists against airline manifests and ground transport reports to quantify cumulative fatigue. One approach involves weighting recent away results more heavily when the opposition completed a multi-leg trip, while another applies sleep-disruption coefficients derived from sports science protocols. These methods produce revised score projections that differ from baseline models by 0.3 to 0.7 goals in soccer matches, creating clearer value signals once odds are compared against the adjusted expectations.
Observers note that late schedule changes, such as venue shifts or weather-related rerouting, amplify these effects because they compress preparation windows further. Preview updates issued 24 hours before kickoff frequently revise travel-adjusted metrics when new flight data surfaces, allowing readers to track how initial lines evolve.
Odds Assessment Adjustments
Oddsmakers integrate journey fatigue through proprietary algorithms that assign point deductions or time penalties calibrated against historical datasets. European soccer markets, for instance, show away underdogs traveling from distant regions opening at longer prices than equivalent local fixtures, reflecting both performance drag and the market's recognition of recovery shortfalls. Similar mechanisms operate in North American thoroughbred racing, where parimutuel pools adjust payouts after observing consistent underperformance by shippers completing cross-country hauls.
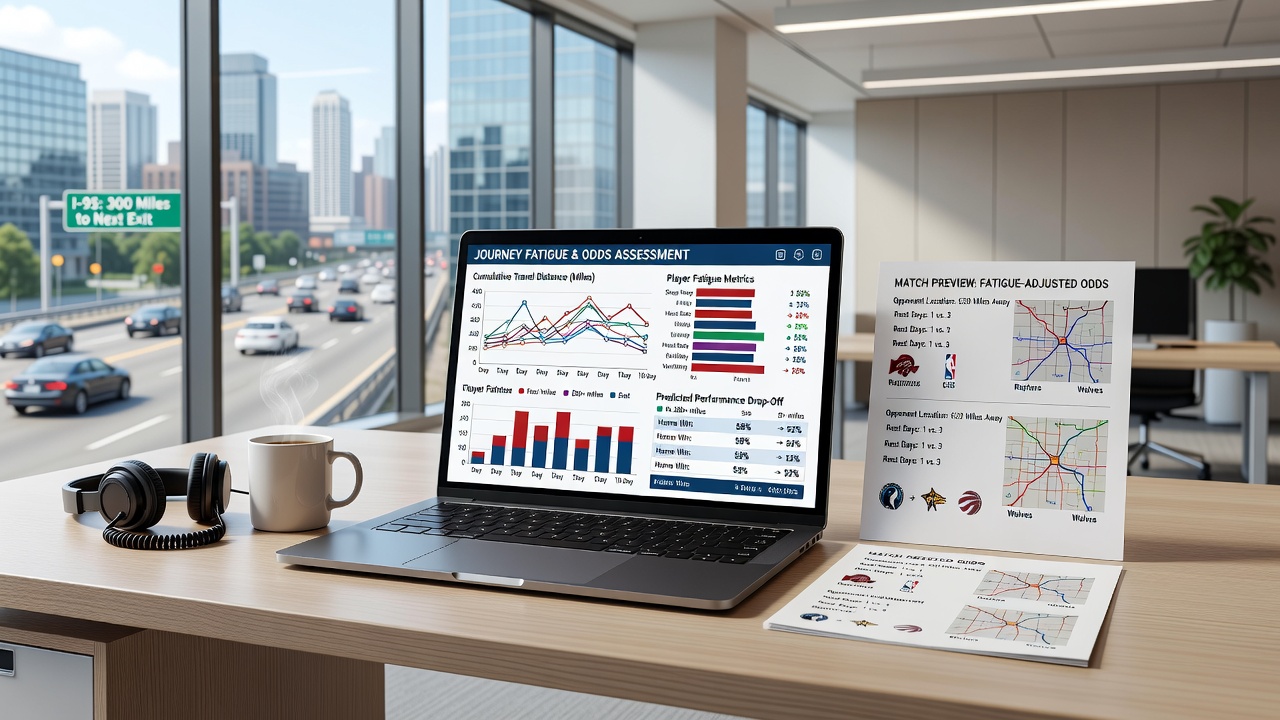
Research conducted at the University of British Columbia examined 1,200 soccer fixtures across five leagues and identified a statistically significant decline in expected points for squads exceeding 800 kilometers of total travel within seven days. The same dataset indicated that betting markets priced this factor with moderate accuracy yet left residual edges when combined with additional variables such as time-zone shifts. Analysts therefore layer the university findings into their models to refine closing-line projections.
Cross-Code Applications
Accumulator builders who blend soccer and racing selections apply fatigue filters uniformly, avoiding legs that pair a long-haul soccer side with a horse that completed an overnight van journey. This filtering reduces variance in multi-leg wagers because correlated fatigue risks are minimized. June 2026 calendars include several midweek international windows followed immediately by domestic rounds, increasing the number of preview segments that highlight travel as the decisive differentiator between otherwise evenly matched contestants.
Industry reports from the European Gaming and Betting Association document rising demand for fatigue-inclusive data feeds among professional syndicates, with subscription services now supplying automated alerts when cumulative mileage thresholds are breached. These feeds integrate directly into odds-assessment platforms, enabling real-time line movements once updated travel manifests become available.
Case Examples from Recent Seasons
During the 2025-2026 campaign, a prominent Premier League side returning from a South American friendly recorded a 22 percent drop in expected goals per 90 minutes across the following three domestic matches, according to Opta-derived tracking. Preview writers who flagged the itinerary in advance produced scorelines closer to observed results than models omitting travel data. On the racing side, a Group 1 contender shipped from Melbourne to Ascot logged a finishing position three places behind its pre-travel market projection, prompting subsequent odds compilers to apply steeper penalties to similar interstate runners.
Those reviewing June 2026 fixtures note multiple instances where clubs scheduled for long-haul commitments appear at inflated prices relative to rested opponents, creating identifiable discrepancies once fatigue coefficients are applied. Racing syndicates operating across Australian tracks report parallel patterns, with trainers adjusting declared runners when cumulative transport exceeds set thresholds.
Conclusion
Travel distance functions as a quantifiable input that refines both qualitative previews and quantitative odds models across soccer and horse racing. Datasets from university studies and league tracking systems supply the empirical foundation for these adjustments, while market operators continue to embed mileage metrics into pricing engines. As June 2026 schedules unfold with dense international and interstate commitments, the integration of journey fatigue remains a standard component of thorough analysis rather than an optional overlay.