Analyzing Trainer Entry Patterns to Identify Overlay Value in Handicap Races
Mia Krüger · Sep 30, 2026
Analyzing Trainer Entry Patterns to Identify Overlay Value in Handicap Races
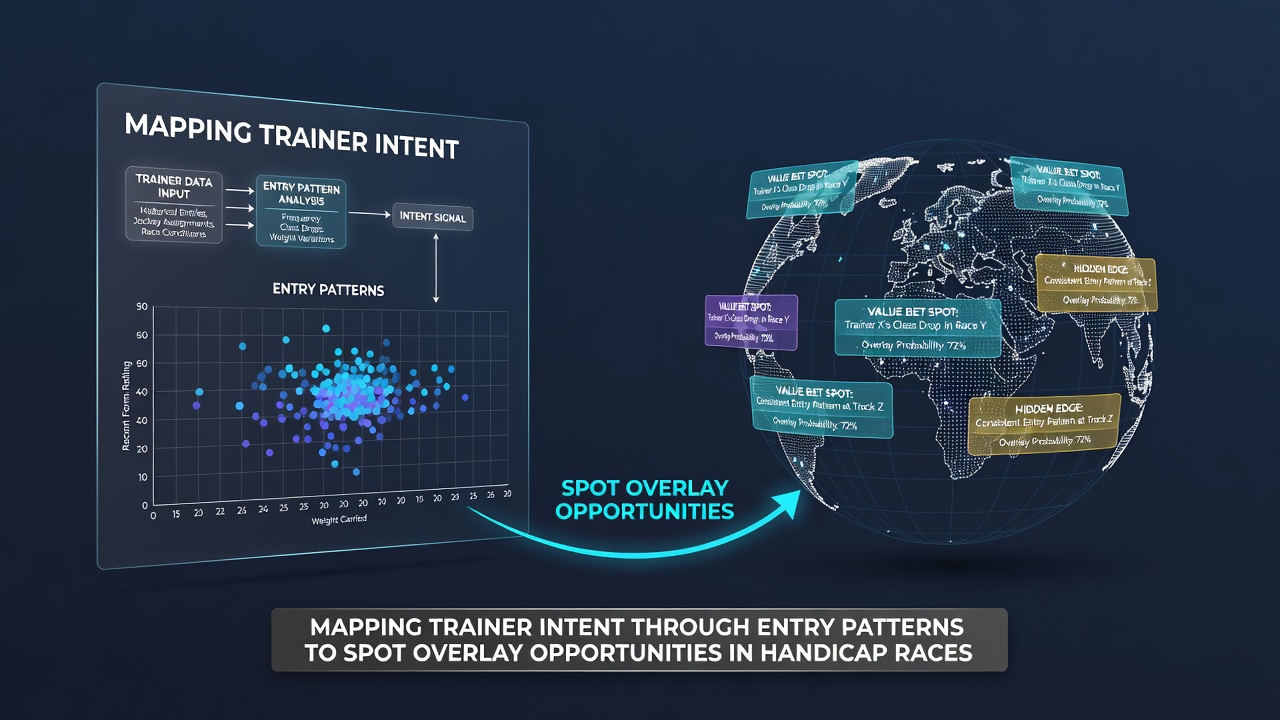
Trainers structure horse entries in handicap races through deliberate patterns that reflect preparation cycles, target weights, and market positioning, while data from multiple racing jurisdictions shows these sequences often precede shifts in betting odds. Observers note that consistent tracking of debut runs, class drops, and distance changes allows analysts to map intent, and September 2026 figures from several tracks indicate rising volumes of such structured campaigns amid expanded fixture lists.
Core Elements of Entry Mapping
Entry records reveal trainer preferences through repeated sequences such as initial runs in novice or maiden company followed by quick switches into handicap company at adjusted weights, and researchers tracking these moves across flat and jumps seasons have documented how certain yards favor specific timing windows. Data indicates horses entered after a 30- to 45-day break following a non-handicap outing frequently carry stable confidence, yet the same patterns also surface when yards seek softer marks before stepping up in class.
Additional signals emerge from yard-level statistics that cover run frequency, surface switches, and jockey bookings, while industry reports compiled by the Association of Racing Commissioners International highlight how trainers in North American circuits apply similar logic to claimers and allowance events that function like handicaps. Those who compile multi-season datasets find clusters of entries around particular race distances or track configurations often precede stronger performances once the horse settles into its mark.
Linking Patterns to Overlay Detection
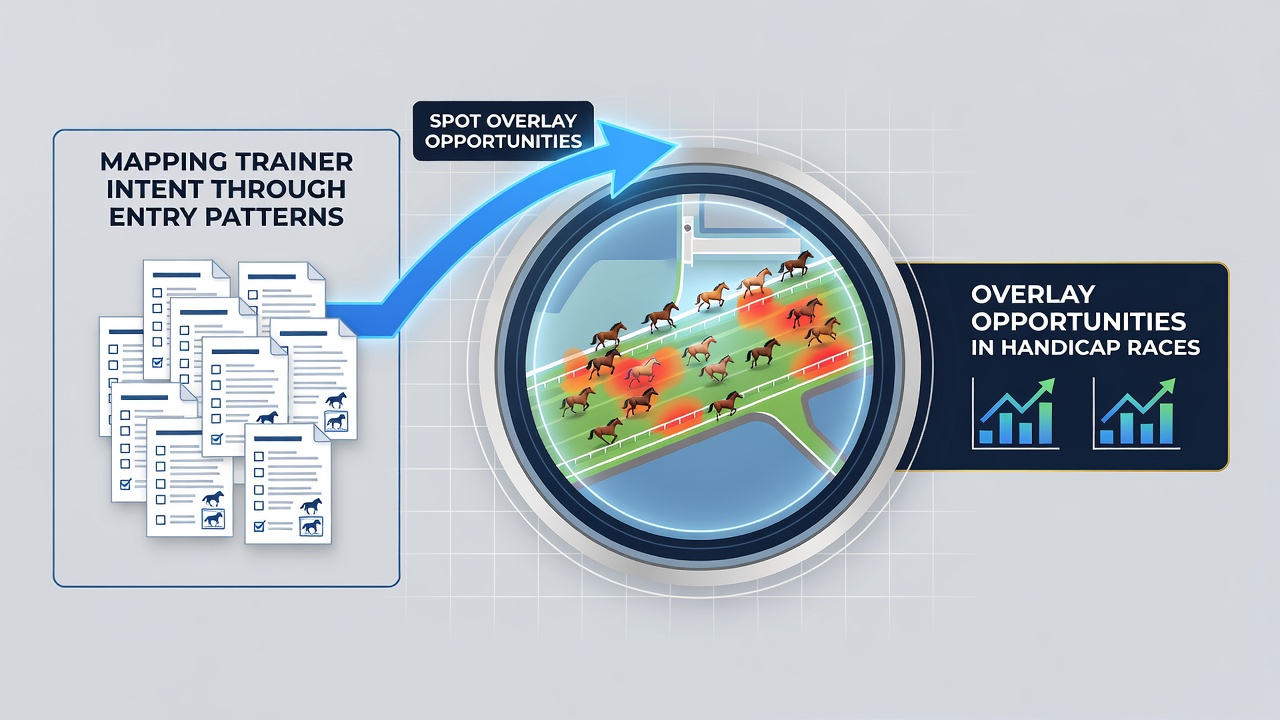
Overlays arise when public odds exceed a horse's assessed probability based on its entry history and recent form, and mapping tools that flag repeated trainer sequences help isolate these discrepancies before markets settle. Figures released in late 2025 and carried forward into September 2026 show increased overlay frequency in midweek handicap fields where late entries cluster around certain trainers, creating pockets of value against benchmark prices derived from official ratings.
One documented approach involves cross-referencing entry dates with official going reports and weight allocations, whereas another layer adds trainer-specific win rates in similar setups across the prior 24 months. Australian Racing Board analyses of comparable data sets confirm that horses entering handicaps after two non-handicap runs at rising distances produce measurable edges when their odds sit 15 percent or more above model estimates. Observers tracking these metrics note the advantage compounds when multiple yard signals align on the same runner.
Regional Variations and Data Sources
European trainers often space entries differently from their Australian or North American counterparts, yet the underlying intent mapping remains consistent across codes, and studies from the University of Sydney's racing analytics group demonstrate how distance and surface transitions function as reliable filters in both hemispheres. Patterns that include a single run on a new surface before handicap targeting appear more frequently in southern hemisphere campaigns, while northern programs show higher concentrations around festival meetings where weights are reassessed mid-season.
Additional granularity comes from integrating stall allocation data and declared runner counts, since trainers who repeatedly place horses in wide draws or large fields may be testing conditions before committing to a serious handicap tilt. Regulatory filings from bodies such as the Association of Racing Commissioners International record these entry behaviors across member jurisdictions, providing a broader baseline than single-country snapshots.
Practical Application in Current Seasons
September 2026 meetings have seen several trainers deploy horses through identical entry ladders that previously delivered overlays, and market monitors report these sequences now attract faster attention from automated systems. Those compiling private databases combine entry timestamps with live odds feeds to flag discrepancies within minutes of declarations, creating alerts that focus on runners whose historical trainer patterns diverge from current pricing.
Case examples drawn from recent campaigns illustrate how a horse entered twice at shorter trips before stepping up in distance often drifts in the morning market, only to shorten once the pattern is recognized by sharper layers. Similar sequences appear in jumps handicaps where trainers use novice hurdles as stepping stones, and the resulting odds gaps widen when public attention remains fixed on more exposed runners.
Conclusion
Entry pattern analysis supplies a structured method for locating overlay opportunities in handicap races by converting trainer sequences into measurable signals, and ongoing data collection across multiple seasons continues to refine these mappings. Observers expect further integration of real-time declaration feeds with historical yard profiles as fixture volumes grow through the remainder of 2026, sustaining the same analytical framework that has already identified repeatable edges in prior campaigns.